
- Summary
-
Designed to analyze customer trends, evaluate promotion effectiveness and optimize staff performance.
Traffic and Scheduling workbench measures historical performance analysis to forecast expected traffic trends, sales levels, and staffing requirements for the next 52 weeks. The objective is to effectively evaluate and manage some of the most important assets to a retail enterprise. The software includes a variety of graphical analysis tools including Hourly Traffic, Hourly Average, Traffic Summary, Traffic Forecast and Sales History to provide an in depth analysis of each store location to display a detailed breakdown of busiest hours and days.
The workbench efficiently tracks Sales, Traffic, and Staff levels and calculates Conversion Rates, Average Transactions, Items per Transaction and Traffic to Staff ratios.
-
-
Benefits
-
Optimize Staff to Customer Ratios to avoid under-staffing
Calculates Conversion Rates to assist in increasing sales levels and profitability
Measures traffic trends through a detailed breakdown of information based on month, week, day or hour
Provides a detailed comparative analysis between stores displaying the best and worst performing store locations
Improves operational efficiency and assists in decision making
Evaluate the performance of promotion campaigns
Evaluate the consequences of changes to a store's internal operations
Evaluate the consequences of changes to a shopping center in which a store is located
Specify minimum staff per hour and the required traffic to staff ratio for scheduling forecasts
Use another store location's weight and season to model another store's traffic, sales and staffing forecasts
Override historical transaction and traffic averages for more accurate forecasting
Forecast future 52 week sales levels based on target conversion rate and Traffic to Staff ratio
Quick and easy navigation is facilitated by utilizing the calendar control and grid interfaces
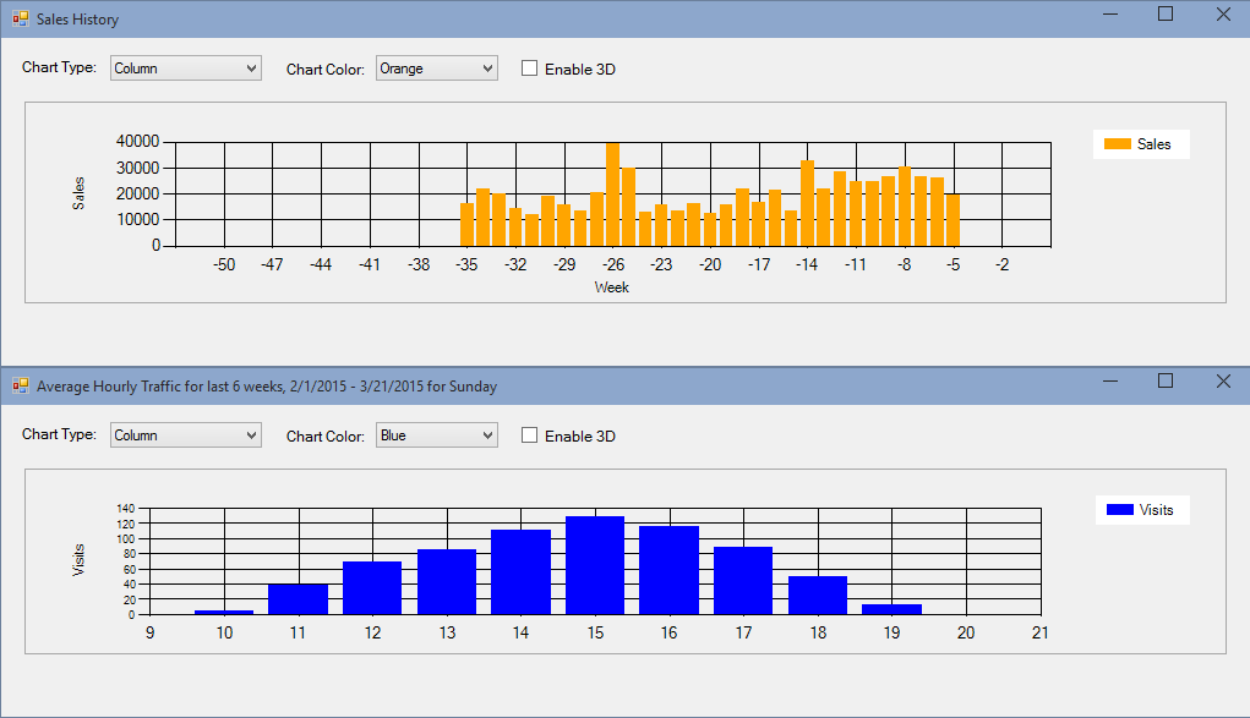
Future and past hourly traffic graphs are utilized for intuitive analysis
Average hourly traffic graphs are based on user determined number of weeks moving average.
Traffic summary allows for store-to-store performance evaluation
Sophisticated data analysis forecast and historical data analyzed by week of year, day or week, hour of week and hour of day
Perform past and future trend analysis using 104 weeks of actual and forecasted information
-