- Cybex BI Dashboard
-
Cybex retail business intelligence dashboard is based on Power BI, Microsoft’s cloud-based analytics service for visualizing, exploring, and extracting insights from data.
-
A New Generation of Business Intelligence
-
Cybex BI Dashboard is about understanding the facts and the relationship between facts in a way that guides decision-making and action. From a technology standpoint, BI Dashboard is a set of tools for transforming raw data into meaningful business insights.
With BI Dashboard, a business analytics cloud service for visualizing and analyzing all of your data in one place, our goal is to bring business intelligence to everyone.
-
Main Objectives
-
Provide quality data sets to end users
Accessible access to impactful, interative reports
Connect to important data through a user friendly interface with ease and confidence
Allow analyst to visually explore important data
Navigate through data quickly, optimized for performance
Easily share reports and dashboards with other users
Empower end users to monitor in real-time what matters most and see results quickly
Explore data to find immediate answers
Allow users to stay connected from anywhere though their mobile device
-
Cybex BI Dashboard Overview
-
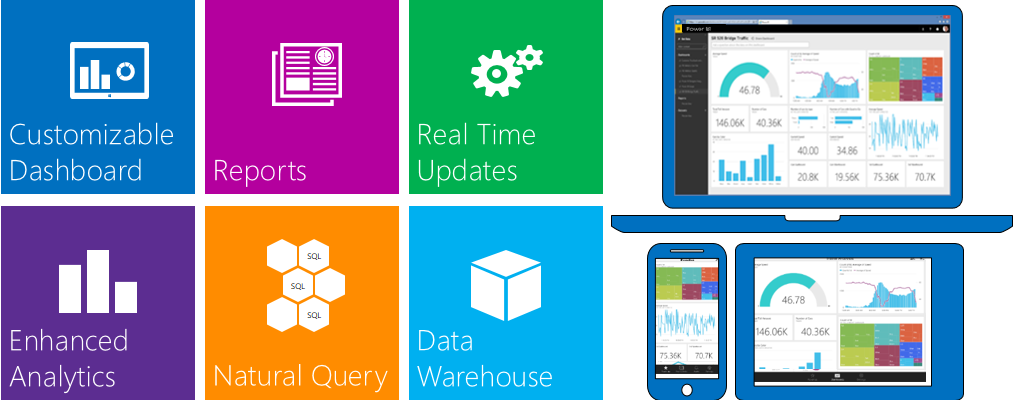
BI Dashboard offers a unique set of features and capabilities designed to help users get the most out of their data. Cybex BI enables anyone to easily connect with their data through live dashboards and reports to explore data through interactive visualizations at any time.
Additionally, BI dashboard is compatible with a set of interactive mobile applications for Windows, iOS and Android to provide access to dashboards and reports from your mobile device.
-
User Experience
-
The Cybex BI service provides
a simple intuitive experience for users to interact
with their data to make insightful business
decisions. It allows users to share dashboards,
explore and enhance reports to get a rich
consolidated view of key information from wherever
they are.
-
Dashboards
-
Cybex BI dashboard is a highly customizable set of data visualizations and charts created from one or multiple reports. The dashboard offers a variety of visualization options including comparison, composition, relationship and geographical charts to display data in a visually appealing manner. Additionally, if a dashboard is live and connected to a real-time data source the visualizations will update continuously, enabling faster insights.
The dashboard is not exclusively for viewing data, it is also an interactive tool. If there is information on a dashboard that you want to look into more deeply, drill down or cross-filter among visualizations or pages to see exactly what is required.
-
Mobile Applications
-
BI Dashboard can be accessed through interactive apps on the Windows, iOS, and Android platforms. The mobile applications include mobile-specific features to optimize for smaller displays and enhance the viewing experience. The user can zoom in and out of visualizations to look at data more closely. They can also set up alerts and notifications to stay on top of changes in data. Furthermore, they can take a snapshot of a visualizations and add notes using highlight features. These snapshots can then be shared with other individuals in an organization via SMS and email.
-
Natural Language Query.
-
The BI dashboard contains a unique feature that allows you to ask any question about your data and produces an answer in the form of new visualization or chart. BI dashboard intelligently filters, sorts, aggregates, groups, and displays data based on key words in the question asked to answer anything about your data.
Q&A is as easy as typing in a question in the Q&A textbox at the top of the dashboard. BI dashboard then generates a chart to answer the question, using the data from the underlying reports. The user can then pin the chart to the dashboard if desired, or modify it by asking more questions.